
INTRODUCTION
SaaS companies are characterized as having the perfect business model because of both the recurring and compounding nature of their revenue streams. Relative to other businesses, they are capital-light and often generate significant cash flows at scale. Investors have become increasingly sophisticated at evaluating SaaS companies and the metrics to measure these businesses are becoming more and more well-known. However, the evaluation process still remains a mystery to many founders and we continue to hear that KPI benchmarks are tough to come by. IVP has had the privilege of evaluating thousands of SaaS companies and backing many of the top SaaS companies of the last decade, including AppDynamics, CrowdStrike, Datadog, Dropbox, GitHub, and UiPath, among others. While there is no magic formula for success, we created this handbook based on our experience to demystify the process and share some pro-tips.
Our process of getting to conviction has both quantitative and qualitative elements. Our quantitative analysis is primarily centered around exploring a company’s growth rate and sales efficiency as key drivers of product-market fit and go-to-market fit. In this handbook, we highlight key formulas and share proprietary benchmarks, while
also providing handy templates to illustrate how best to structure and present data. On the qualitative side, we’ll spend time with management, as it is critical that we believe we are backing leaders who can clearly articulate and execute against a compelling vision. We’ll also speak to customers to understand satisfaction levels and size a company’s addressable opportunity. Part of our overall assessment centers around believing whether a company can be 3x, 5x, 10x, or 25x larger on its key fundamental metrics and ultimately whether it can return one-third, half, or potentially the entire fund.
While it used to be that all of this work would kick off during a formalized 1-2 month fundraise process, rounds are now coming together much faster than before. Speed to term sheet is being seen as a competitive advantage and investors have inverted the sequence of diligence, doing a fair amount of this market-related work on their own in order to: 1) move quickly during a future process or 2) to preempt a round. Every investment firm has its own approach to diligence and every company can choose to run its own fundraising playbook. Our focus at IVP is to be company-friendly while doing the highest leverage work we need to gain conviction. While no fundraising process is the same, we believe that it is critically important to understand how investors will evaluate your business, which is why we created this handbook to arm you, the CEO, COO, or CFO with all that you need to be prepared for your next fundraise.
FINANCIALS
In this section, we focus on analyzing a company’s financials and understanding its historical and projected growth trajectory.
Annual Recurring Revenue (ARR)
ARR is the key metric that investors, management, and the board will focus on as it most accurately reflects the scale and momentum of the business. Dissecting the components of your company’s ARR will reveal a lot about the underlying health of the business fundamentals. The definition of ARR is perennially debated but a commonly accepted definition is “the value of recurring revenue from existing customers that are currently paying and using your product normalized to a single calendar year”.
The main components of ARR are as follows:
Beginning ARR + New ARR + Expansion ARR - Churn ARR = Ending ARR
For companies with consumption based pricing (vs. seat or license-based pricing), the way to calculate ARR is to take monthly recognized revenue (i.e. consumption revenue).
Calculating churn can be tricky with these models as a decrease in spend is not necessarily true churn. We’d recommend that companies distinguish between true churn (i.e. customer has left the platform) vs lower consumption.
For a SaaS company with consumption based pricing, the best way to express the components of ARR is as follows:
Beginning ARR + New ARR + Net Expansion AR - Churn ARR = Ending ARR
(Do not include ARR churn from lower utilization in "Churn ARR". Rather, net it out of Expansion ARR.)
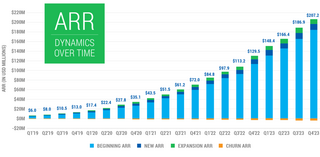
A helpful way to illustrate how the components of ARR change over time is to show a stacked column chart that is broken down by quarter. See below for an example of how to graphically represent the different components of your company’s ARR over time.
ARR PRO-TIPS
CARR vs ARR
Clarify the difference between Contracted ARR (CARR) and ARR. The main difference between CARR and ARR is that CARR includes ARR from customers that haven’t gone live yet but have signed a contract. Investors will typically value companies based on ARR, not CARR, and will tease this out as part of diligenceTCV vs ACV
Total Contract Value (TCV) is the total value of a customer contract over the duration of the contract. TCV divided by the duration of the contract in years equals Annual Contract Value (ACV). In most situations, a company’s total ACV should be fairly close to ARR. There isn’t a universally agreed upon definition of ACV like there is with ARR and companies will sometimes include one time implementation fees or professional services into ACV which drives some discrepancy. That being said, ACV and ARR are commonly used interchangeably for SaaS companies.Average ACV
Investors will often ask you about your average ACV, which represents the average amount per year a customer contract is worth. As you scale, and especially as you target larger accounts, it is important to show that this metric is trending upwards.Bookings vs Billings
The difference between Bookings and Billings frequently causes confusion given how similar the two metrics sound. A “Booking” represents the total value of a contract either on a total or annual basis (i.e. TCV Bookings or ACV Bookings). A “Billing” represents the invoice amounts billed to customers and reflects when cash is collected. Billings will usually lag Bookings because there is always a delay when a customer is booked before cash is collected, unless a multi-year deal is collected upfront.
Growth Rate
Investors look at a company’s growth rate as an indicator of business momentum and how well a company’s product is resonating with customers. Investors will pay a premium for growth and if a company is growing quickly, on the surface, things are going well. So if the success of your startup is often measured by your company’s growth rate, how do you know if this growth is fast enough?
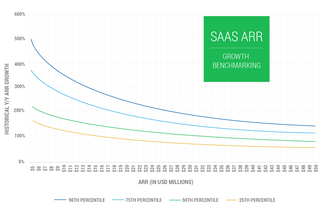
IVP analyzed the year-over-year growth rate for all of the private SaaS companies we’ve evaluated over the last few years. A company’s growth rate naturally decelerates as it achieves greater scale, so it’s important to keep scale in mind when benchmarking growth. We will note that these growth rates are not representative of all SaaS companies. The companies in our set have prior venture funding from top-tier firms and would be considered best-in-class in today’s market. See below for how your company stacks up against companies we’ve recently evaluated.
As an example to help you best interpret the chart, let’s assume your company is at $10M ARR. If the year-over-year historical growth rate was 250% ($2.8M to $10.0M ARR), this would be close to the 75th percentile. Conversely, if the year-over-year growth rate was 100% ($5.0M to $10.0M ARR), this would fall below the 25th percentile.
The Power of Hypergrowth
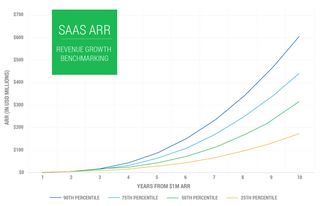
While growth rates typically decelerate as a company gets larger, the growth is compounding. To put this into perspective, a company consistently growing at the 90th percentile for a decade would generate over $600M in ARR by year 10. Conversely, a company growing at the 25th percentile over that same time period would generate less than $200M in ARR by year 10.
GROWTH RATE PRO-TIPS
All Revenue is Not Created Equal
The quality of the revenue matters just as much as the quantity and growth rate. Investors will dig in to understand the source of growth and whether this growth is efficient. Investors also value subscription revenue more highly than services or other revenue. In the above benchmarking, we focus on recurring revenue only.Hard to Re-accelerate
Companies sometimes will show re-accelerating revenue growth in their financial models but this rarely occurs in the real world. If you show any re-acceleration you must support it with credible logic. Some examples might be a new product launch or re-organized sales org that will drive more efficient selling.New Revenue Growth
There are two sources of growth: revenue from new customers and expansion revenue from existing customers. Total revenue growth is important but investors will also want to see revenue from new customers grow consistently each month as well.
Financial Statements
Investors will review your financial statements to evaluate your company’s growth, margin profile, sales efficiency, and the strength of the underlying business fundamentals. Investors will commonly ask for two years of quarterly historical financials and two years of projected financials. Investors underwrite their returns based on the forecast you share with them and will spend the bulk of financial diligence assessing how realistic the forecast is. While it might seem harmless to put out an extremely aggressive forecast to paint a rosy picture for your company, investors will judge your future performance against it so you should be prepared to defend your assumptions. On the flip side, you shouldn’t sandbag your projections either. It’s important to present a plan that is both aggressive and achievable.
Below is an example of how to most effectively lay out your historical and projected financials. Start by highlighting ARR and then by including a traditional P&L that goes from revenue down to operating income and EBITDA. Including a balance sheet and cash flow statement are helpful but not required. At a minimum, it is helpful to also include an estimate of Free Cash Flow (Operating Cash Flow minus CapEx) and ending cash balances by quarter. In the P&L, breaking down Operating Expense (OPEX) into S&M (Sales & Marketing), R&D (Research & Development), and G&A (General & Administrative) is important because it allows the investor to diagnose where your burn is coming from and to calculate sales efficiency. Earlier stage companies won’t have the accounting infrastructure in place to properly categorize OPEX, but you can approximate the breakdown based on headcount. Lastly, investors will often request that you provide monthly or quarterly detail so they can assess recent momentum and also understand any potential seasonality.
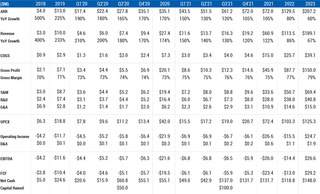
With this data, investors will conduct numerous analyses and likely schedule a financial diligence call to better understand the key assumptions. The level of detail behind these questions will vary based on the maturity of the company and sophistication of the investor, but expect investors to focus on growth, margins, unit economics, and burn. See below for questions that investors commonly ask during financial diligence calls.
Illustrative Financial Diligence Call Questions
- How is revenue recognized?
- Why is there such a big difference between ARR growth and GAAP Revenue growth?
- What are the main components of COGS?
- How is cash collected (upfront or ratably)?
- How did you come up with the assumptions for the next 12-24 months?
- What is driving the large step-up in S&M spend? Can you discuss the plan to scale up the sales team?
- What assumptions in the model are you most comfortable with and what assumptions are you least comfortable with?
- Why is there such a large delta between EBITDA and FCF?
- Why was [Growth, Margins, Burn, etc.] irregular in this quarter?
- Is this the board approved plan or a more aggressive fundraising plan? What are the key differences in assumptions?
For most startups, the question of whether to add a VP Finance comes up around the Series A / B stage and we typically see this hire as one of the most delayed hires. We’d recommend that SaaS companies bring on a VP Finance or Head of Finance by the Series B at the latest as it is important to have a solid financial foundation at this stage of the company’s maturity and investors will want to be able to review financial information that they can comfortably rely on.
FINANCIAL STATEMENTS PRO-TIPS
Scenario Analysis
Investors may augment your model or re-build their own model in order to stress test their own assumptions. Their financial diligence questions will often be used to confirm their own model assumptions.Plan vs Actual
Investors you pick will judge your performance against the plan you share. Investors that don’t invest but track you for the next round will likely evaluate your future performance against the same plan.Up to Date Historicals
Try to share historical numbers for months that have already passed. Investors will want to know the most up to date historical information.Unified, Single-Source-of-Truth P&L
Don’t present separate financial analyses that don’t tie back to the P&L. The exhibits shown in the pitch deck should match the P&L. The historical and projected financials should be presented together in one singular model vs spread out in multiple models.Tie-out Cash Balances
Don’t show ending cash balances that don’t tie to FCF.Bottoms-up vs Top-down
Projections that are driven by S&M assumptions are generally more believable and defensible than top-down projections.
Churn / Retention
SaaS companies generate streams of recurring revenue that either expand or contract over time. Some customers will churn over time (i.e. product isn’t a good fit, going out of business, etc.) and some customers will expand over time (i.e. adding more seats, purchasing more premium features, increasing product usage, etc.). In many cases, SaaS companies will benefit from what’s called net negative churn, which occurs when expansion exceeds churn. If churn is “net negative”, this means that the business can grow organically from expansion within accounts.
Net Dollar Retention
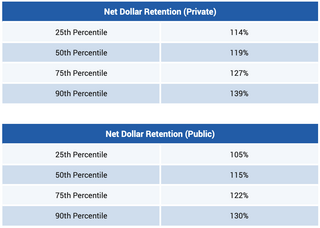
The most commonly analyzed retention metric is a company’s Net Dollar Retention Rate (NDR for short), a metric that is now commonly reported by all publicly-traded SaaS companies. The Net Dollar Retention Rate is generally calculated on a cohort basis (see spaghetti charts below) and looks at how much ARR all customers that were around one year ago have today versus one year ago. A Net Dollar Retention Rate that is greater than 100% means that churn is “net negative”, meaning each cohort is growing organically. NDR is a proxy for a company’s organic growth rate. If a company has a Net Dollar Retention rate of 130%, it implies that the company could theoretically stop acquiring new customers and grow 30% year-over-year because the existing ARR would grow to be 130% of its original size in a year. Net negative churn is an extremely powerful dynamic that allows SaaS businesses to compound growth at scale for a long time.
IVP benchmarked the NDR of every private SaaS company that we’ve evaluated at $10M ARR as well as the NDR of 50+ publicly traded SaaS companies. We’d note that a company’s NDR can vary dramatically depending on the size of its customers. As a rule of thumb, a good NDR for an enterprise SaaS company is 120%+ with best-inclass companies above 130%. For companies selling into SMBs (small and medium businesses), a good rate is 90%+. See below for how your company compares.
Gross Dollar Retention
A secondary metric that we analyze as it relates to retention is a company’s Gross Dollar Retention (GDR for short). GDR is a helpful measure to evaluate how sticky a company’s product is. NDR combines the net effect of expansion and churn together. For example, a company with 130% NDR may have a 60% expansion rate but a 30% churn rate or it may have a 35% expansion rate and a 5% churn rate. NDR masks the very different customer behavior of these two companies. Because GDR factors in only a company’s churned revenue, it helps to truly measure a product’s stickiness. Companies that have high GDR typically sell products that are hard to rip and replace. Security and Infrastructure Software companies tend to have very high GDR.
Quick Ratio
The Quick Ratio is a way to determine whether or not a SaaS business has a churn problem. The ratio is calculated by adding new ARR and expansion ARR and dividing it by churn ARR. A Quick Ratio of 5x+ indicates that the company has favorable churn dynamics but anything less than 5x suggests there may be a leaky bucket issue. If you fall into this camp, it is critical to speak to your customers to understand why they churn as a leaky bucket can be a big strain on your company’s overall growth rate. It is far more cost-efficient to prevent leakage than to consistently try to add new revenue, especially as you scale. See below for the formula to calculate quick ratio.
Quick Ratio = New ARR + Expansion ARR / Churn ARR
CHURN / RETENTION PRO-TIPS
Standard Methodology
Companies calculate NDR in different ways but the industry standard is to look at all customers from one year ago as a single cohort. You divide how much ARR that cohort has now by how much ARR they had one year ago.NDR vs 12-month Cohort Expansion
Don’t confuse NDR with 12-month cohort expansion. Cohorts tend to expand the fastest in their first year of existence so 12-month cohort expansion (i.e. M12 ARR / M1 ARR) will almost always overestimate NDR.NDR by Segment
Different customer segments (i.e. $100K+ ACV vs <$100K ACV) tend to have different NDR characteristics. It’s okay to show NDR for different customer segments, but make sure to appropriately footnote it.
Cohort Data
A cohort analysis is one of the most powerful techniques investors use to assess longterm trends in customer retention and lifetime value. Typically, cohorts are evaluated by segmenting users by month of acquisition and are based on a variety of metrics, including revenue, ARR, lifetime value, payback, etc.
Layer-Cake Chart
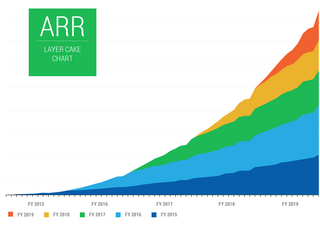
A layer-cake chart is a helpful visual to help you understand how much revenue comes from new vs existing customers. Below is a chart from Slack’s S-1 that shows significant expansion from existing accounts. This view clearly shows expansion dynamics in the context of the company’s overall ARR scale and growth.
Spaghetti Chart
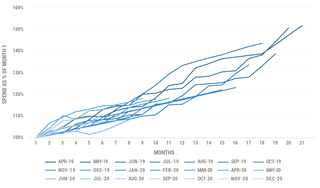
In a spaghetti chart, data is segmented and then analyzed over time. Spaghetti charts can be used to evaluate the health of any KPI, including revenue, net / gross retention, engagement, payback, etc. Below are two charts that separate ARR by monthly cohorts and examine the trends over time. The chart below is indexed as a percentage of month 1 spend.
When evaluating cohorts, investors will look to answer four key questions:
- Are the newer cohorts increasing in size? If revenue cohorts are increasing in size, this means that each month, your new customers are spending, in aggregate, more dollars with you. Increased new business is a powerful lever for growth.
- Is each individual cohort showing expansion over time? If cohorts are showing expansion, this means existing customers are increasing their spend over time. Increased expansion is another powerful lever of growth.
- Are the cohorts relatively consistent? One of the benefits of a SaaS business is its inherent predictability. If there is consistency among the cohorts, this means the business is quite predictable. Companies with transactional pricing or seasonality may show some volatility in cohorts.
- Are new cohorts improving relative to others? If recent cohorts are improving, this means customers are spending more, faster in their customer lifecycle. This is a signal that the company’s product is resonating well and a signal for accelerating growth.
Evaluating cohorts is an incredibly important way to measure customer retention and engagement over time.
GO-TO-MARKET
In this section, we share with you the key go-to-market analyses we conduct to understand the drivers and efficiency of growth.
Sales Efficiency
Any SaaS company can scale quickly if the management team throws money at customer acquisition. It’s not uncommon in the current capital-rich environment to see companies growing rapidly, but inefficiently. Investors use growth as a proxy for product-market fit, but will dig further to gauge whether this growth is efficient. The most commonly used metric that investors will use to assess business efficiency is called the “Magic Number” and it focuses on selling efficiency.
Magic Number
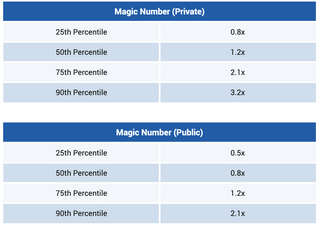
There are countless different ways to measure sales efficiency, but the most commonly accepted metric is the “Magic Number”. It is a simple calculation that represents the ratio between how much net new ARR a company adds in the current quarter vs. how much S&M expense there was in the prior quarter. The generally accepted benchmark is that a Magic Number of 1.0x is the most efficient ratio between S&M spend and ARR generation. This means that if a company puts in $1 into it’s S&M engine, $1 of net new ARR should come out. If your Magic Number is above 1.0x, you should consider investing more into sales and marketing. If your Magic Number falls below 0.5x, it might be worth better understanding where you can optimize. You might be asking why the formula looks at S&M expense from the prior quarter (vs the current quarter)? It’s a shortcut to take into account typical sales + implementation cycles.
The 1.0x Magic Number benchmark is just that, a benchmark. IVP has seen many companies be very successful with a Magic Number below 1.0x and unsuccessful with a Magic Number greater than 1.0x. Your company’s Magic Number is just a shortcut for investors to assess sales efficiency and there is often a lot of nuance behind it. Investors will also use the Magic Number calculation to sanity check the assumptions behind your forecast. If your company has historically operated with a Magic Number of 0.7x but your financial projections imply a Magic Number of 2.0x next year, you should have a well-reasoned explanation for why this will happen.
Magic Number = Current Quarter ARR - Last Quarter ARR / Last Quarter S&M Spend
IVP benchmarked the Magic Number of every private SaaS company at $15M ARR that we’ve evaluated in the last few years as well as the Magic Number of 50+ publicly traded SaaS companies. See below to see how your company compares.
Gross Margin Adjusted Magic Number
Not all revenue dollars are created equal because different businesses have different gross margin profiles. Different SaaS companies will have different gross margin profiles driven by 1) infrastructure costs, 2) customer support costs, 3) services vs software split, and many other factors. A company with 85% gross margins sends a lot more gross profit dollars down to the bottom line than a company with 60% gross margins. As a result, investors will usually multiply Magic Number by gross margin to arrive at a “GrossMargin-Adjusted Magic Number”, which is the best approximation for sales efficiency.
Gross Margin Adjusted Magic Number = Magic Number x Gross Margin
CAC Payback
Investors will also focus on how quickly a SaaS business pays back the cost of customer acquisition. An easy way to calculate your company’s CAC Payback is to simply take the inverse of your company’s Magic Number multiplied by 12 months. If the Magic Number represents the amount of new ARR generated from sales and marketing spend, the inverse multiplied by 12 represents how many months it takes for the new ARR to recoup the initial S&M spend. It’s important to adjust the Magic Number for Gross Margin in order to accurately gauge how long it takes to recoup customer acquisition costs. Typically, a good payback period to target is between 12 to 18 months.
CAC Payback = 1 / Gross Margin Magic Number x 12
SALES EFFICIENCY PRO-TIPS
Increasing Sales Efficiency
Don’t present a financial model that assumes outlandish increases in Magic Number unless there is a good reason for why sales efficiency would increase.Fully Load Your CAC
Include all customer acquisition related costs (i.e. sales commissions, brand marketing, travel, conferences, etc.) when calculating CAC payback, including employee spend.
Top Customers
Investors will ask for a list of spend by top customers as it is important to understand the distribution of spend across a customer base. A company serving a large number of small-volume customers will have low customer concentration and a firm where a handful of customers account for a majority of the business will have high customer concentration. If there are a few customers that drive a majority of revenue, this can be seen as a risk as losing one of these customers can significantly impact revenue and growth. Not only this, large customers may have leverage to exert pricing pressure and can push to divert company resources to support their needs vs the needs of smaller customers. On the flip side, a large customer can be helpful in driving credibility and awareness. Investors will ask to speak with your biggest customers to better understand their overall satisfaction and how you are meeting their needs.
While we discussed cohorts above, it is particularly important to understand the spending habits of your largest customers. Investors will look at your top 10 customers to see how much they have increased spend over the last year. This can be biased so investors will also take a snapshot of top customers from the year prior to see how much they are spending a year later.
Sales Organization
Investors will spend a lot of time learning about the company’s GTM motion and understanding the sales organization. Investors will typically schedule a diligence call with the VP Sales / CRO to understand how the team is structured, how they are compensated, and what hiring plans look like. See below for an example of questions an investor may ask.
Illustrative GTM Diligence Call Questions
- Please provide an overview of your sales organization and GTM motion (i.e. inbound vs outbound, inside sales vs field sales, etc.)
- What is your hiring plan for the next year?
- What are average quotas and what level of attainment do you typically see?
- How long does it take for a sales rep to get fully ramped?
- How much time do you give an underperforming rep to turn things around before letting them go?
- What are average OTEs for the sales reps?
- Please provide an overview of your sales compensation strategy.
- What sales pipeline coverage ratio do you typically need to comfortably hit the quarter?
- Total ARR is growing but new ARR added per quarter looks flat. Why is that?
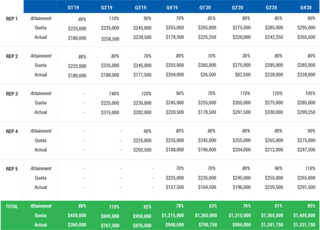
Investors will commonly ask to see historical quota attainment by sales rep and will want to see consistent attainment across the entire sales organization, not just from a small handful of reps driving the bulk of the revenue. Having the majority of quota coming from a small handful of reps means that the company doesn’t have a repeatable GTM motion that can scale. Investors will also check to see if reps are consistently overperforming their quota attainment. If that’s the case, it’s a sign that quotas are too low and the company isn’t setting aggressive enough goals for the team. Investors typically expect to see ~75% of fully ramped reps hitting 100%+ of their quota. This demonstrates both productivity and consistency across the sales organization.
Sales Pipeline
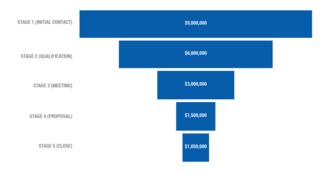
A company’s Sales Pipeline is a leading indicator of future growth. Investors will often ask to see the company’s current Sales Pipeline to understand what deals could potentially move the needle for the upcoming quarter and how achievable the goal is. One metric that investors will commonly ask about is a company’s historical “Sales Pipeline Coverage Ratio”, which is the ratio between how big a company’s sales pipeline is heading into a quarter and how much new ACV is expected to be generated in the quarter.
Sales Pipeline Coverage Ratio = Total Outstanding Sales Pipeline / Next Quarter ACV Bookings
Conventional wisdom says that a healthy Sales Pipeline Coverage Ratio is 3x but that varies based on the type of company. For companies with very long sales cycles, they typically need a much larger pipeline (i.e. 5x+) to confidently hit their ACV target for the quarter. For companies with very short sales cycles, it can sometimes be lower. A Sales Pipeline analysis is only relevant for companies with an inside or field sales driven business. SaaS companies with a self-serve GTM motion are more likely to be paid marketing driven making a pipeline less relevant. See below for an example of how to lay out your sales pipeline.
SALES PIPELINE PRO-TIPS
Sanity Check Current Quarter
Don’t forecast an aggressive new ACV goal for the upcoming quarter if you don’t have the sales pipeline to support it.Historical Pipeline
Coverage Investors may ask to see your pipeline coverage numbers over time.Discuss the Needle Movers
Be prepared to discuss key deals currently in the pipeline or that have a high probability of closing or could meaningfully change the next few quarters
MARKET RESEARCH
In this section, we look to understand more qualitative aspects of a business that complements our financial analysis.
Market Sizing
Market sizing is the process of estimating the potential of a market and is an important exercise for investors and management alike. Below we’ll discuss a few key market sizing definitions as well as two methodologies we typically use to estimate market size.
Market Potential
Market potential is the potential value of a product service and is the most optimistic view of market size. The calculations typically include buyers that are not a focus today but may be in the future as you expand your product offering and target customer profile.
Total Addressable Market (TAM)
When investors ask for an estimate of market size, they often are looking for the total addressable market (TAM). Objectively, it is the maximum amount of revenue a business could generate by selling its product and service in a specific market. There are two common methods by which you can calculate TAM:
- Top-down market sizing uses industry research from Gartner and Forrester as an input that includes your market and other similar markets. Through a variety of assumptions, you’ll break this down into an amount that represents an estimate for your specific market.
- Bottoms-up market sizing is calculated by multiplying the total number of customers by an average selling price (or estimated future selling price). It is called bottoms-up because you start with the building blocks (number of customers, price, etc) to formulate a view on the market opportunity.
It is worthwhile to estimate a market size using both the top-down and bottoms-up methodologies. The benefit of this approach is that it can help triangulate the estimates. If the results are far off, it is worth thinking through the assumptions some more. We typically favor the bottoms-up approach as it is more granular. When sharing your view of market size to investors, it is helpful to paint a picture of analogous markets that you could expand to as you scale up your product and go-to-market. It is also important to share details on the assumptions you used to estimate market size.
Served Addressable Market (SAM)
In the absence of monopoly control, capturing 100% of the total addressable market is impossible for a business. SAM represents the portion of TAM that a company can actually reach with their current product, sales team, resellers, and channel partners.
MARKET SIZING PRO-TIP
- TAM Expansion
A common pitfall is that sizing an existing market may actually underestimate a company’s market opportunity. Some products that offer better solutions than existing options can help grow a market. Similarly, differences in pricepoint and delivery method (i.e. cloud vs on-premise) can open up a product to more customers.
Customer Calls
The financials, market size, and data only tell half of the story. Investors will spend the bulk of their time speaking with customers to assess if the product is mission-critical, gauge customer satisfaction, understand future expansion potential, and understand why the customer picked your product over alternatives. An investor may ask for on-list customer references but investors will want to speak to off-list customers as these calls tend to be less biased. In today’s market, it’s very common for investors to do these calls ahead of a fundraising process to allow them to move quickly. For off-list calls, investors will work with a professional network like GLG or Guidepoint or reach out to customers they may know from their network. Companies have no control over what investors will ask, but below is a selection of the most commonly asked questions during customer calls.
Illustrative Customer Call Questions
- How did you find [insert company name here]?
- What other alternatives did you assess and why did you pick [insert name here]?
- What problem were you trying to solve?
- How disruptive to your business would it be if [insert name here] went away?
- Is this a nice to have or need to have?
- What does the product do well and what are the key areas for improvement?
- How is the product priced?
- Do you think the pricing is fair, too expensive, or cheap relative to the value you get?
- How much do you currently spend and how do you expect your spend to increase going forward?
- How would you rate your customer satisfaction on a scale of 1-10?
CUSTOMER CALL PRO-TIP
- Off-list Customer Calls
It’s become increasingly common for investors to speak with customers ahead of a fundraising process. Most will either ask for permission or work through a credible expert network like GLG or Guidepoint on a blinded basis with customers that have opted in. If you feel strongly about investors not speaking to your customers, we encourage you to be upfront about that when you meet them.
Management Team
The most important part of any company evaluation is the investor’s assessment of the strength of the management team. As investors go through the initial stages of diligence from the first meeting to the initial follow-up, they will spend the majority of the time with the CEO and CFO. As investors begin to dig in further, they will often ask to meet other functional leaders including the VP Sales, VP Engineering, VP Product, VP Marketing, and VP People, among others. This will help them gauge the strengths and weaknesses of the management team and also the CEO’s ability to recruit top talent. Investors will often ask for 30-60 minute meetings with each of these functional leaders in order to understand their backgrounds, responsibilities, and key priorities. Many of these meetings can happen after a term sheet is issued and are not usually a gating item during diligence.
MANAGEMENT TEAM MEETINGS PRO-TIPS
Meeting Prep
We’d recommend that the CEO ask investors to send over a high-level agenda or questions beforehand so the management team can be prepared and make the best impression. Otherwise, your team runs the risk of being blindsided with topics they may not be prepared to speak to. It is imperative to make sure your team is prepared for these meetings and that they put forward their best effort.Get Feedback From Your Team
Fundraising is a two-way street so ask your management team for feedback on the investor after they have met with them. How prepared were they? How good were their questions? Were they respectful? The answers to these questions tend to be leading indicators of what an investor is like to work with. It’s near impossible to remove an investor so feedback from your team is invaluable.CEO Optional
It is optional for a CEO to join these meetings. A benefit of joining is that you can provide additional context and get to know the investors better, but these meetings can also add up and be quite time consuming. On the flip side, by letting your functional leaders run these meetings solo, it demonstrates that you trust them.
VALUATION
All of the work that we outlined in this handbook ultimately informs the price that investors are willing to pay for a company. Valuation is equal parts art and science. The “art” of valuation is subjective and involves an investor’s assessment of the market opportunity, product feedback, the CEO’s vision, and strength of the management team. The “science” of valuation is objective and is based on your company’s scale, growth, and business fundamentals (i.e. sales efficiency, NDR, churn, etc.).
Private Comparables
Investors generally keep a running list of private SaaS comps for recent rounds and focus most on two metrics:
- Enterprise Value (Pre-$ Valuation less Cash) divided by current ARR
- Enterprise Value divided by NTM (Next Twelve Months) ARR
(NTM ARR refers to annualized recurring revenue that you expect to generate 12 months into the future.)
The multiples that investors are ultimately willing to pay for a company is influenced by several factors that drive their conviction in the company’s long-term performance. This includes the company’s growth rate, capital efficiency, and strength of its core SaaS metrics (NDR, GDR, Magic Number, etc.), as well as the size of the market opportunity and the strength of the team. It is important to note that private software company ARR multiples are at an all time high. There are risks of raising at too high of a valuation, including the potential for a future down-round if there is a market correction or if your company fails to grow into the valuation before you need to raise more capital. This all being said, it is near impossible to forecast future market conditions.
Public Comparables
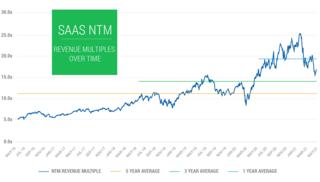
For SaaS companies at larger scale, investors will also review publicly traded companies as part of their valuation exercise. Publicly-traded companies trade on a multiple of NTM revenue (revenue generated over the next 12 months) as companies typically do not report ARR publicly. ARR can be implied by multiplying quarterly subscription revenue by 4. See below for a chart that shows how NTM revenue multiples for publicly traded companies have trended over time. As you can see, we are at all-time highs.
Returns Modeling
Investors will also typically build a returns model to approximate the expected return of the investment. As part of this, investors typically build multiple cases (i.e. Stretch, Management, Base, and Low) with varying assumptions for each case on growth, profitability, and future dilution. Exit multiples for each case are based on current and historical trading levels for high-growth SaaS companies (see public comparables above) and are dialed up or down depending on the growth and profitability characteristics of your company. Each of these assumptions drives towards a “Multiple of Invested Capital” (MOIC) and “Internal Rate of Return” (IRR) for each case upon exit, with the results sometimes blended based on probability-weighted outcomes. In order to issue a term sheet, investors need to believe that there is the potential for strong economic returns at the market clearing price, with the timeframe and return thresholds depending on each firm’s own internal strategy.
CRAFTING YOUR STORY
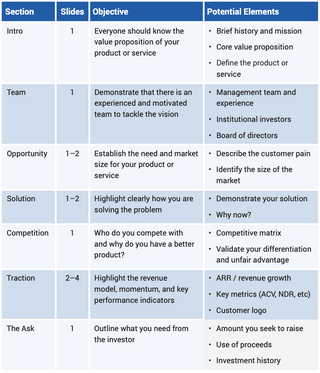
The beginning of a fundraising process often starts with a presentation. Not all fundraising processes require a pitch deck, but it’s generally an effective way to bring a new investor up to speed and communicate your company’s vision. The structure of a pitch deck can vary but below we’ve included some thoughts on how best to tell a compelling story. These slides include a variety of the data points covered above.
STORYTELLING PRO-TIPS
What Does Your Company Do?
Make sure everyone you are pitching has a strong understanding of what your company does upfront. In this market, investors should have done their homework before the pitch, but it is still important to make a strong impression. This is even more important when presenting to a team’s full partnership.Team Upgrades
If your team is not filled out, that is ok. Be upfront about the gaps and your plan to fill those holes. Investors who are really excited may offer to introduce you to potential candidates in their network.Provide Historical Context
When discussing the opportunity, set up a historical evolution of your category and explain why we are at an inflection point today and why your solution is the best in the market. The ‘why now’ and ‘why you’ are both critical for investors.Know the Financials Cold
Make sure that you understand the financials enough to be able to explain them in detail. Investors will want to know that you have a strong handle on the business and an understanding of the financials can be a leading indicator.What is Your Ask?
Be clear about your “ask” and able to speak to your plan for the use of proceeds. Investors may push you on valuation expectations and it is up to you on how much to share. Often we hear “we are raising $X at Y% dilution”.CEO is the Main Presenter
CEOs should be doing the talking during the pitch. If a CFO or COO is doing most of the talking, this can be a yellow flag.Polish Your Presentation
If you have the time or resources, hire a designer to make these slides look professional. A poorly-designed pitch deck with too much text can make a poor first impression and not allow you to most effectively tell your company’s story
CONCLUSION
Fundraising can be a stressful and time-consuming process for companies. We’re hopeful that this handbook will arm you with the information to be better prepared to answer an investor’s key questions. If you have any questions along the way, please reach out to us and we’ll be happy to lend a hand. Good luck!